
Key Takeaways
- The U.S. stock market delivered another strong performance in 2024 with the S&P 1500 Index returning 23.95% over the period.
- The bull market in stocks and U.S. economic expansion remain in place despite repeated predictions from certain strategists of an imminent reversal in both. However, the S&P 1500 Index has become increasingly concentrated in high-valuation stocks, which present risks.
- In this environment, Davis Opportunity Fund (DOF) is unique in that it represents a select list of high-conviction ideas that have delivered stronger earnings growth than the benchmark at a far lower valuation. We believe the portfolio is attractively positioned on multiple fronts.
Market Perspectives:
Looking Beyond
In the most recent economic readings, U.S. gross domestic product is growing at 3.1% while the inflation rate has moderated to 2.7%. While inflation is not quite at the Federal Reserve’s target level of 2%, the Fed has nonetheless seen reason to adopt a slightly more accommodative posture than was the case during the COVID and post-COVID periods.
Unemployment is hovering at slightly above 4%, which is an indication of a relatively tight labor market, and consumer spending has remained resilient. This is despite repeated pronouncements over the last several years from certain strategists that the current bull market in stocks and the U.S. economic expansion were due for imminent reversal. Those predictions have not materialized and we believe that both the markets and the economy appear sound relative to history.
It is worth noting at the same time that the S&P 1500 Index has become increasingly concentrated in high-valuation stocks, particularly in the technology sector, and this does present risks. That said, there is no obligation on the part of investors to own the S&P 1500 Index as currently constituted. It is, after all, an index portfolio and not the entire market of available opportunities. We advise clients to look beyond the so-called Magnificent Seven stocks to identify attractive businesses whose valuations remain far more reasonable.
In this regard, the market is offering a meaningful number of different options. Some of these appear far more attractive to us than others, and it is up to investment managers and investors to choose from them in a conscious, thoughtful way. In our view, the broad stock market continues to offer good value in a range of areas, but investors must be more selective to capture those opportunities while avoiding or keeping in check exposure to more highly appreciated securities.
This material includes candid statements and observations regarding investment strategies, individual securities, and economic and market conditions; however, there is no guarantee that these statements, opinions or forecasts will prove to be correct. This is not a recommendation to buy, sell or hold any specific security. Past performance is not a guarantee of future results. The Attractive Growth and Undervalued reference in this material relates to underlying characteristics of the portfolio holdings. There is no guarantee that the Fund performance will be positive as equity markets are volatile and an investor may lose money.
Portfolio Review:
Four Economic Themes
The overall positioning of Davis Opportunity Fund (DOF) can be described by its contrast with the S&P 1500 Index in terms of number of portfolio holdings, historical earnings per share growth, and forward price-to-earnings (P/E) multiples as follows:
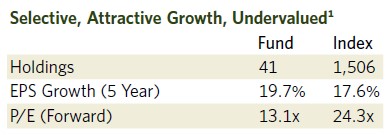
As shown above, what makes DOF rather unique in today’s environment is that the fund represents a finite and select list of our highest conviction ideas (versus an entire broad market portfolio) that have been able to deliver five-year earnings per share growth above the benchmark. At the same time, DOF is trading at a far lower forward P/E multiple than the S&P 1500 Index. Combining these metrics, we believe that our portfolio is more attractively positioned than an unmanaged index on multiple fronts.
The portfolio’s current focus is on businesses in four main areas of the economy: (1) dominant healthcare companies (predominantly healthcare services that are both cheap and underestimated in our view), (2) leading technology-related companies, (3) durable financial services, and (4) industrials, where a sub-theme is the continued rapid adoption of electrification across industries.
The balance of the portfolio represents more individualized investment opportunities in areas such as copper production (Teck Resources), offline and online gaming (MGM Resorts), biofuel and energy production (Tourmaline Oil), among others.
Healthcare, the fund’s largest sector allocation, has been a headwind to recent performance and is without question under a cloud. We believe that the healthcare businesses we own, which include UnitedHealth Group, Cigna, CVS and Viatris among others, are undervalued versus our expectations for normalized earnings power and margins.
“We like the low expectations built into their share prices, and consider that owning a handful of companies in the sector may help us diversify individual company risk.”
The pie for healthcare spending continues to grow overall in the U.S. economy. We have selected on a bottom-up basis those companies we feel are best-positioned to benefit from the inexorable, longtailed demographic reality that we have an aging population. That stated, individual company results can be lumpy at times—for example, when costs move differently from revenues. Market share shifts take place, favoring some for a time versus others. For these reasons, we own a basket of healthcare companies. We like the current valuations and low expectations built into their share prices, and consider that owning a handful of companies in the sector may help us diversify individual company risk. Overall, we believe we have meaningful exposure to the whole pie but have diversified that exposure by company.
Leading technology-related companies such as Meta Platforms, Alphabet and Amazon.com delivered very strong results in 2024, both bottom-line and in share price performance. While this group has appreciated, we anticipate that their earnings power should expand considerably over time, if not in straight-line fashion then on a normalized basis. We base our view on the monumental, global scale of the addressable markets in which these companies operate, their respective leadership positions competitively, their vast internal financial resources, constant innovation and cutting-edge products, their human capital, and the specific economics of the business models they represent, in particular their return on invested capital.
Within financial services, we have selected businesses where we have high confidence in their per-share total return potential as well as their durability through full economic cycles. Representative holdings include Berkshire Hathaway, Capital One Financial and Markel Group.
Industrial businesses in the portfolio currently include AGCO, a farm equipment manufacturer, and Schneider Electric, a global leader in commercial and residential electrical products and one of a number of portfolio holdings facing the world’s future power and electrification needs.
Overall, the common thread that runs through the entire portfolio is a strong focus on durability, earnings growth potential over the long term, and attractive current valuation.
Outlook:
Favoring Selectivity
As part of investing for the long run and through different phases of market cycles, investors may at times have to operate in a market environment like we have today with major stock indexes trading at high valuations relative to history and showing a degree of concentration that may be a reason for pause.
We have a constructive view based on the simple fact that one need not follow an index portfolio. In other words, today’s setup argues in favor of active management and selectivity, above all, and we feel DOF is well-positioned for the long term. At 2024 year-end, the fund held 41 high-conviction investments with an average five-year earnings per share growth rate of 19.7% and an average forward P/E of 13.1 times (or a 46% discount relative to the S&P 1500 Index).
For more than 50 years we have navigated a constantly changing investment landscape guided by one North Star: to grow the value of the funds entrusted to us. We are pleased to have achieved strong results thus far and look forward to the decades ahead. With more than $2 billion of our own money invested in our portfolios, we stand shoulder to shoulder with our clients on this long journey.2 We are grateful for your trust and are well-positioned for the future.
Five-year EPS Growth Rate (5-year EPS) is the average annualized earnings per share growth for a company over the past 5 years. The values shown are the weighted average of the 5-year EPS of the stocks in the Fund or Index. Approximately 9.91% of the assets of the Fund are not accounted for in the calculation of 5-year EPS as relevant information on certain companies is not available to the Fund’s data provider. Forward Price/Earnings
(Forward P/E) Ratio is a stock’s price at the date indicated divided by the company’s forecasted earnings for the following 12 months based on estimates provided by the Fund’s data provider. These values for both the Fund and the Index are the weighted average of the stocks in the portfolio or Index.
As of 3/31/25 Davis Advisors, the Davis family and Foundation, our employees, and Fund directors have more than $2 billion invested alongside clients in similarly managed accounts and strategies.
This material is authorized for use by existing shareholders. A current Davis Opportunity Fund prospectus must accompany or precede this material if it is distributed to prospective shareholders. You should carefully consider the Fund’s investment objective, risks, charges, and expenses before investing. Read the prospectus carefully before you invest or send money.
This material includes candid statements and observations regarding investment strategies, individual securities, and economic and market conditions; however, there is no guarantee that these statements, opinions or forecasts will prove to be correct. These comments may also include the expression of opinions that are speculative in nature and should not be relied on as statements of fact.
Davis Advisors is committed to communicating with our investment partners as candidly as possible because we believe our investors benefit from understanding our investment philosophy and approach. Our views and opinions include “forward-looking statements” which may or may not be accurate over the long term. Forward-looking statements can be identified by words like “believe,” “expect,” “anticipate,” or similar expressions. You should not place undue reliance on forward-looking statements, which are current as of the date of this material. We disclaim any obligation to update or alter any forward-looking statements, whether as a result of new information, future events, or otherwise. While we believe we have a reasonable basis for our appraisals and we have confidence in our opinions, actual results may differ materially from those we anticipate.
Objective and Risks. The investment objective of Davis Opportunity Fund is long-term growth of capital. There can be no assurance that the Fund will achieve its objective. Some important risks of an investment in the Fund are: stock market risk: stock markets have periods of rising prices and periods of falling prices, including sharp declines; common stock risk: an adverse event may have a negative impact on a company and could result in a decline in the price of its common stock; foreign country risk: foreign companies may be subject to greater risk as foreign economies may not be as strong or diversified. As of 3/31/25, the Fund had approximately 20.6% of net assets invested in foreign companies; headline risk: the Fund may invest in a company when the company becomes the center of controversy. The company’s stock may never recover or may become worthless; large-capitalization companies risk: companies with $18 billion or more in market capitalization generally experience slower rates of growth in earnings per share than do mid- and small-capitalization companies; mid- and small-capitalization companies risk: companies with less than $18 billion in market capitalization typically have more limited product lines, markets and financial resources than larger companies, and may trade less frequently and in more limited volume; manager risk: poor security selection may cause the Fund to underperform relevant benchmarks; depositary receipts risk: depositary receipts involve higher expenses and may trade at a discount (or premium) to the underlying security and may be less liquid than the underlying securities listed on an exchange; emerging market risk: securities of issuers in emerging and developing markets may present risks not found in more mature markets; fees and expenses risk: the Fund may not earn enough through income and capital appreciation to offset the operating expenses of the Fund; and foreign currency risk: the change in value of a foreign currency against the U.S. dollar will result in a change in the U.S. dollar value of securities denominated in that foreign currency. See the prospectus for a complete description of the principal risks.
The information provided in this material should not be considered a recommendation to buy, sell or hold any particular security. As of 3/31/25, the top ten holdings of Davis Opportunity Fund were: Quest Diagnostics, 7.11%; Capital One Financial, 6.98%; Markel Group, 5.68%; CVS Health, 4.92%; Viatris, 4.49%; Cigna Group, 4.25%; Teck Resources, 3.69%; Tourmaline Oil, 3.68%; Humana, 3.66%; U.S. Bancorp, 3.52%.
Davis Funds has adopted a Portfolio Holdings Disclosure policy that governs the release of non-public portfolio holding information. This policy is described in the statement of additional information. Holding percentages are subject to change. Visit davisfunds.com or call 800-279-0279 for the most current public portfolio holdings information.
The Global Industry Classification Standard (GICS®) is the exclusive intellectual property of MSCI Inc. (MSCI) and S&P Global (“S&P”). Neither MSCI, S&P, their affiliates, nor any of their third party providers (“GICS Parties”) makes any representations or warranties, express or implied, with respect to GICS or the results to be obtained by the use thereof, and expressly disclaim all warranties, including warranties of accuracy, completeness, merchantability and fitness for a particular purpose. The GICS Parties shall not have any liability for any direct, indirect, special, punitive, consequential or any other damages (including lost profits) even if notified of such damages.
We gather our index data from a combination of reputable sources, including, but not limited to, Lipper, Wilshire and index websites.
The S&P 1500 Index includes all stocks in the S&P 500, S&P MidCap 400, and S&P SmallCap 600. This index covers approximately 90% of U.S. market capitalization. Investments cannot be made directly in an index.
Item #4776 12/24 Davis Distributors, LLC, 2949 East Elvira Road, Suite 101, Tucson, AZ 85756, 800-279-0279, davisfunds.com
Opportunity Fund
Annual Review 2025