
Key Takeaways
- The U.S. stock market had its third consecutive year of double-digit returns in 2025—it has shown notable resilience but is also trading at a high valuation and at the most extreme level of concentration in almost three decades.
- In this market environment we believe it is critical for a portfolio manager to be active, selective and flexible, and we are advising clients to decrease exposure to the passive indexes and their stretched valuations.
- Davis Opportunity Fund (DOF) returned +22.02% in 2025, materially outperforming the S&P 1500 Index, and we believe the fund is well-positioned to continue delivering superior earnings growth while trading at a steep discount to the benchmark.
The average annual total returns for Davis Opportunity Fund’s Class A shares for periods ending June 30, 2026, including a maximum 4.75% sales charge, are: 1 year, 18.37%; 5 years, 9.09%; and 10 years, 12.33%. The performance presented represents past performance and is not a guarantee of future results. Total return assumes reinvestment of dividends and capital gain distributions. Investment return and principal value will vary so that, when redeemed, an investor’s shares may be worth more or less than their original cost. For most recent month-end performance, visit davisfunds.com or call 800-279-0279. Current performance may be lower or higher than the performance quoted. The total annual operating expense ratio for Class A shares as of the most recent prospectus was 0.94%. The total annual operating expense ratio may vary in future years. Returns and expenses for other classes of shares will vary.
This material includes candid statements and observations regarding investment strategies, individual securities, and economic and market conditions; however, there is no guarantee that these statements, opinions or forecasts will prove to be correct. All fund performance discussed within this material refers to Class A shares without a sales charge and are as of 12/31/25, unless otherwise noted. This is not a recommendation to buy, sell or hold any specific security. Past performance is not a guarantee of future results. The Attractive Growth and Undervalued reference in this material relates to underlying characteristics of the portfolio holdings. There is no guarantee that the Fund performance will be positive as equity markets are volatile and an investor may lose money.
Market Perspectives:
Spotlight on Active Management
In 2025 the U.S. stock market achieved its third consecutive year of double-digit returns in rather broad-based fashion but led primarily by technology stocks. The market’s resilience in the face of major economic, geopolitical and technological shifts is noteworthy. However, the S&P 1500 Index, representing the broader market, is trading at a relatively high valuation with a forward price-to-earnings (P/E) multiple of nearly 26 times. Furthermore, the index is more concentrated today than we have seen since the bubble of the late 1990s as measured by the percentage of the index’s value residing in 10 megacap names, almost all of which are technology-driven companies.
We believe that active management is an appropriate solution in today’s market environment. It gives a portfolio manager the flexibility to be highly selective at the security level and maintain rational diversification through consciously determined position weightings and sector composition. Put simply, we are advising clients to decrease their exposure to the stretched valuations of the passive indexes and reallocate to actively managed equity portfolios run by seasoned and proven managers.
Looking ahead, we believe we may be entering a period during which active management proves its value again over passive management. This would be quite the opposite of what has transpired over the most recent decade.
Lastly, we note that there is a preponderance of surplus cash sitting on the sidelines or being allocated to illiquid asset classes such as private equity. We believe both are sub-optimal solutions given the opportunities available in long-only, liquid equity portfolios of well-chosen securities which we believe can outperform cash and inflation over the long term while avoiding the illiquidity and leverage traps of private equity as a category.
Portfolio Review:
Conscious Investment Ideas
In 2025, DOF returned +22.02%, dramatically outperforming the S&P 1500 Index’s +17.02% return. Our results were driven primarily by consciously chosen investment ideas ranging from healthcare services and technology shares to financial services.
The table below summarizes the portfolio’s overall position in terms of risk and reward characteristics versus its benchmark.
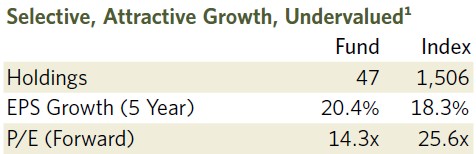
As shown, DOF trades at a very steep discount to the S&P 1500 Index yet the portfolio’s earnings per share growth rate over the last five years of over 20% is well ahead of the index’s growth rate of around 18%.
In other words, we are offering a portfolio that is a relative bargain in our eyes versus its passive alternative without sacrificing on the growth characteristics one finds desirable in the equity universe.
What all our investments have in common are verifiable financial strength, experienced management teams and some form of what we believe are enduring competitive advantages.
Within healthcare, we were very opportunistic throughout 2025 and the prior year, investing in a decisive way when shares of leading managed care insurers stumbled as operating costs surged rather unexpectedly for the group. Our key thesis was that these businesses were trading at low to very reasonable multiples on depressed earnings relative to historical levels, yet stood a good chance of recovering, possibly in dramatic fashion. Seemingly small margin improvements on low profit margins can translate into very large percentage increases in structural earnings power. We believe the market’s valuations for these portfolio companies underestimated the potential for a rebound in their bottom-line economics. UnitedHealth is a representative investment in this category.
Outside of managed care investments currently in the portfolio, we also own certain leaders in generic pharmaceuticals (Viatris) and in lab and diagnostics services (Quest Diagnostics). We see good value in these holdings based on the view that healthcare spend in the U.S. is likely to continue expanding, increasing the addressable market opportunity for our healthcare names.
Our technology-driven holdings span companies in social media, online search, cloud computing and e-commerce. We own select positions within the Magnificent 7 but trimmed those positions based on valuation and size where appropriate throughout 2025.2 Representative holdings in this category include Meta Platforms, Alphabet and Amazon.com. We also own semiconductor companies that we find attractive but which do not trade at very high multiples. The latter group includes so-called “picks and shovels”—workhorse technology businesses such as Applied Materials that have strong competitive positions in their respective end markets, a long track record of creating value for shareholders, and valuations that are at reasonable levels for the financial strength and expected growth rates we have built for them into our models.
"We believe in maintaining a rational balance of risk and reward factors, not only at the individual security level but also in how we arrange portfolio sectors and weightings, unlike the unmanaged indexes where security and sector weightings are decided largely by share price momentum."
Within financials, the portfolio looks quite different from any major passive index today. A core financial holding in the fund is Capital One Financial. This entity has a strong consumer finance and credit card division, a deposit-rich bank that is growing share in the U.S., and the payment processing platform that it acquired with Discover Financial Services.
Its economics look more attractive than certain widely owned technology companies yet it trades at only 13–14 times forward earnings, or a 7–8% earnings yield (forward earnings per share divided by current price and distinguishable from dividend yield). Capital One Financial is also the fifth-largest holder of AI-related patents among major U.S. companies. This is an advantage that we believe is in the early stages of transforming an already highly profitable business model into a far more profitable one.
Elsewhere in the portfolio we hold several rather unique special situations. A representative holding in this category is Wesco International, a niche U.S. business that operates as a business-to-business purveyor of electrical and communications products, as well as a services provider for logistics and supply chain management. Despite its low profile in the market, Wesco International delivered returns in 2025 that were more than twice the benchmark’s, driven by strength in its underlying business results. It has been one of our strongest performers in the portfolio over the past five years.
We also own stakes in companies that we have been quietly building in the areas of energy and commodities. Coterra is a representative example of an energy business that the fund currently holds. Teck Resources, a global copper producer based in Canada, reflects our interest in select commodities that serve as critical inputs to the robust electrification trend underway in the U.S. and elsewhere.
Outlook:
Rational Risk and Reward
For investors who recognize today’s valuation bubble in the S&P 1500 Index and other major indexes, Davis Opportunity Fund offers a solution for navigating the market environment in a thoughtful way. We believe in the prudence of maintaining a rational balance of risk and reward factors, not only at the individual security level but also in how we arrange portfolio sectors and weightings. This is in sharp contrast to the unmanaged indexes, where security and sector weightings are determined largely by share price momentum. We also believe that surplus cash sitting on the sidelines should be revisited in the new year given the likelihood of falling interest rates and the relatively more attractive total return potential of well-chosen equities.
Together on This Journey
For more than 50 years, Davis Advisors has navigated a constantly changing investment landscape guided by one North Star: to grow the value of the funds entrusted to us. We are pleased to have achieved strong results thus far and look forward to the decades ahead. With more than $2 billion of our own money invested in our portfolios, we stand shoulder to shoulder with our clients on this long journey.3 We are grateful for your trust and are well-positioned for the future.
Five-year EPS Growth Rate (5-year EPS) is the average annualized earnings per share growth for a company over the past 5 years. The values shown are the weighted average of the 5-year EPS of the stocks in the Fund or Index. Approximately 14.30% of the assets of the Fund are not accounted for in the calculation of 5-year EPS as relevant information on certain companies is not available to the Fund’s data provider. Forward Price/Earnings (Forward P/E) Ratio is a stock’s price at the date indicated divided by the company’s forecasted earnings for the following 12 months based on estimates provided by the Fund’s data provider. These values for both the Fund and the Index are the weighted average of the stocks in the portfolio or Index.
The “Magnificent 7” is a group of seven dominant, high-performing U.S. technology companies that have a significant influence on the stock market. The companies that make up the Magnificent 7 are: Alphabet, Amazon, Apple, Meta Platforms, Microsoft, Nvidia, and Tesla.
As of 6/30/26 Davis Advisors, the Davis family and Foundation, our employees, and Fund directors have more than $2 billion invested alongside clients in similarly managed accounts and strategies.
This material is authorized for use by existing shareholders. A current Davis Opportunity Fund prospectus must accompany or precede this material if it is distributed to prospective shareholders. You should carefully consider the Fund’s investment objective, risks, charges, and expenses before investing. Read the prospectus carefully before you invest or send money.
This material includes candid statements and observations regarding investment strategies, individual securities, and economic and market conditions; however, there is no guarantee that these statements, opinions or forecasts will prove to be correct. These comments may also include the expression of opinions that are speculative in nature and should not be relied on as statements of fact.
Davis Advisors is committed to communicating with our investment partners as candidly as possible because we believe our investors benefit from understanding our investment philosophy and approach. Our views and opinions include “forward-looking statements” which may or may not be accurate over the long term. Forward-looking statements can be identified by words like “believe,” “expect,” “anticipate,” or similar expressions. You should not place undue reliance on forward-looking statements, which are current as of the date of this material. We disclaim any obligation to update or alter any forward-looking statements, whether as a result of new information, future events, or otherwise. While we believe we have a reasonable basis for our appraisals and we have confidence in our opinions, actual results may differ materially from those we anticipate.
Objective and Risks. The investment objective of Davis Opportunity Fund is long-term growth of capital. There can be no assurance that the Fund will achieve its objective. Some important risks of an investment in the Fund are: stock market risk: stock markets have periods of rising prices and periods of falling prices, including sharp declines; common stock risk: an adverse event may have a negative impact on a company and could result in a decline in the price of its common stock; foreign country risk: foreign companies may be subject to greater risk as foreign economies may not be as strong or diversified. As of 6/30/26, the Fund had approximately 23.3% of net assets invested in foreign companies; headline risk: the Fund may invest in a company when the company becomes the center of controversy. The company’s stock may never recover or may become worthless; large-capitalization companies risk: companies with $22.7 billion or more in market capitalization generally experience slower rates of growth in earnings per share than do mid- and small-capitalization companies; mid- and small-capitalization companies risk: companies with less than $22.7 billion in market capitalization typically have more limited product lines, markets and financial resources than larger companies, and may trade less frequently and in more limited volume; manager risk: poor security selection may cause the Fund to underperform relevant benchmarks; depositary receipts risk: depositary receipts involve higher expenses and may trade at a discount (or premium) to the underlying security and may be less liquid than the underlying securities listed on an exchange; emerging market risk: securities of issuers in emerging and developing markets may present risks not found in more mature markets; fees and expenses risk: the Fund may not earn enough through income and capital appreciation to offset the operating expenses of the Fund; and foreign currency risk: the change in value of a foreign currency against the U.S. dollar will result in a change in the U.S. dollar value of securities denominated in that foreign currency. See the prospectus for a complete description of the principal risks.
The information provided in this material should not be considered a recommendation to buy, sell or hold any particular security. As of 6/30/26, the top ten holdings of Davis Opportunity Fund were: Quest Diagnostics, 6.59%; Viatris, 6.25%; Wesco International, 6.06%; Devon Energy, 4.13%; CVS Health, 4.04%; MGM Resorts, 4.02%; Solventum, 3.60%; Capital One Financial, 3.35%; U.S. Bancorp, 3.14%; Cigna Group, 2.89%.
Davis Funds has adopted a Portfolio Holdings Disclosure policy that governs the release of non-public portfolio holding information. This policy is described in the statement of additional information. Holding percentages are subject to change. Visit davisfunds.com or call 800-279-0279 for the most current public portfolio holdings information.
The Global Industry Classification Standard (GICS®) is the exclusive intellectual property of MSCI Inc. (MSCI) and S&P Global (“S&P”). Neither MSCI, S&P, their affiliates, nor any of their third party providers (“GICS Parties”) makes any representations or warranties, express or implied, with respect to GICS or the results to be obtained by the use thereof, and expressly disclaim all warranties, including warranties of accuracy, completeness, merchantability and fitness for a particular purpose. The GICS Parties shall not have any liability for any direct, indirect, special, punitive, consequential or any other damages (including lost profits) even if notified of such damages.
The ranges reflected for large, mid, and small cap reflect the current ranges utilized by the S&P Composite 1500 Market Cap Guidelines, as may be amended from time to time. The current ranges are: large-capitalization, over $22.7 billion; mid-capitalization, between $8.0 billion and $22.7 billion; small-capitalization, under $8.0 billion.
We gather our index data from a combination of reputable sources, including, but not limited to, Lipper, Clearwater Wilshire Atlas and index websites.
The S&P 1500 Index includes all stocks in the S&P 500, S&P MidCap 400, and S&P SmallCap 600. This index covers approximately 90% of U.S. market capitalization. Investments cannot be made directly in an index.
After 4/30/26, this material must be accompanied by a supplement containing performance data for the most recent quarter end.
Item #4776 12/25 Davis Distributors, LLC, 2949 East Elvira Road, Suite 101, Tucson, AZ 85756, 800-279-0279, davisfunds.com
Opportunity Fund
Annual Review 2026