Manager
Manager Video Commentary
Share

Key Takeaways
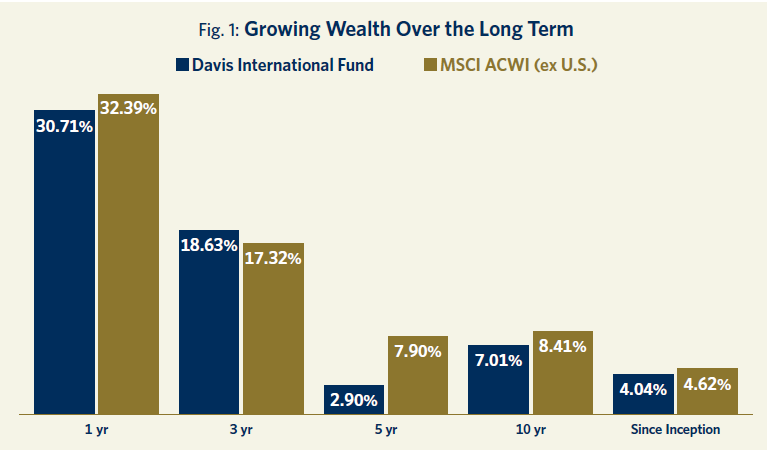
- Davis International Fund (DIF) returned +30.71% in 2025, slightly underperforming the MSCI ACWI (All Country World Index) ex US benchmark.
- Our performance in 2025 was driven by strength in specific technology, financial and industrial holdings. During the period we trimmed certain positions mainly on valuation and redeployed capital elsewhere.
- While invested selectively across regions, the fund has a significant overweight in China, the world’s most dynamic economy outside the U.S. Our investments there include life insurers, which we believe are on a long-term secular growth path in Asia.
- Due to our highly targeted investment process our portfolio holds only a small number of names but has a higher earnings growth rate and lower valuation on average than the index. This selectivity—our active share is 96%—is what makes us optimistic about the fund’s future prospects.
The average annual total returns for Davis International Fund’s Class A shares for periods ending December 31, 2025, including a maximum 4.75% sales charge, are: 1 year, 24.50%; 5 years, 1.90%; and 10 years, 6.49%. The performance presented represents past performance and is not a guarantee of future results. Total return assumes reinvestment of dividends and capital gain distributions. Investment return and principal value will vary so that, when redeemed, an investor’s shares may be worth more or less than their original cost. For most recent month-end performance, click here or call 800-279-0279. Current performance may be lower or higher than the performance quoted. The total annual operating expense ratio for Class A shares as of the most recent prospectus was 1.05%. The total annual operating expense ratio may vary in future years. Returns and expenses for other classes of shares will vary.
This material includes candid statements and observations regarding investment strategies, individual securities, and economic and market conditions; however, there is no guarantee that these statements, opinions or forecasts will prove to be correct. All fund performance discussed within this material refers to Class A shares without a sales charge and are as of December 31, 2025, unless otherwise noted. This is not a recommendation to buy, sell or hold any specific security. Past performance is not a guarantee of future results. The Attractive Growth and Undervalued reference in this material relates to underlying characteristics of the portfolio holdings. There is no guarantee that the Fund performance will be positive as equity markets are volatile and an investor may lose money.
Performance:
Power of Active Shares
Davis International Fund (DIF) posted a return of +30.71% in 2025, slightly below the +32.39% return of the MSCI ACWI ex US benchmark. The fund has a long track record of growing wealth for its shareholders, as shown below.
In this report we discuss the factors behind our performance as well as the contributors and detractors to those results. We go through some of the capital allocation decisions we have made and explain where we are seeing opportunities in the world.
In general, we are very optimistic about the outlook for the portfolio. The three pillars of our optimism are outlined below—namely, our selectivity, and the high earnings growth potential of our portfolio companies together with their relatively low valuations compared to the index.
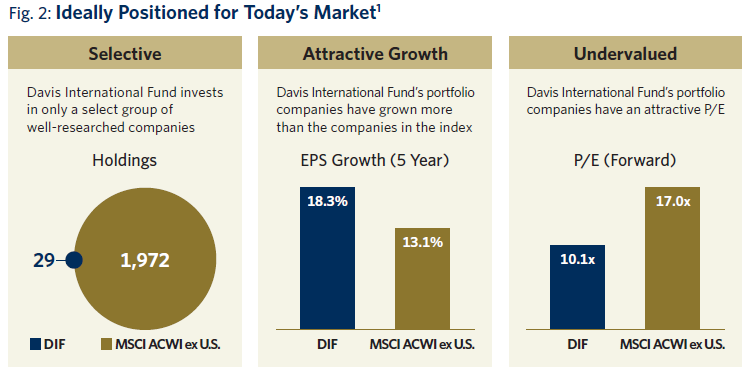
The fund holds only 29 names compared with the nearly 2,000 names in the index. This means we are extremely selective. Our companies have grown earnings per share at a much faster rate on average than the companies in the index and yet their valuation on a weighted price/earnings basis is meaningfully lower than the index, and low on an absolute basis as well. We think this combination of higher growth and lower valuation bodes very well for future absolute and relative performance.
Among the factors driving our results in 2025, selected technology holdings were strong contributors to performance. Samsung, the leader in memory chip manufacture, which increasingly is important for AI, was a big contributor. Tokyo Electron, a semiconductor equipment manufacturer based in Japan, also made a strong contribution. Prosus and Naspers, which own over 20% of Tencent, the Chinese multimedia conglomerate, helped performance in 2025. Finally, NetEase, which is the second-largest video game company in China, was a contributor.
Our financial holdings were also positive contributors. These included Danske Bank, the leading bank in Denmark, Ping An Insurance, the second-largest life insurer in China, and AIA, a Pan-Asian life insurer. Industrials made a positive contribution as well, among them Aumovio, a recent spinoff from the German auto parts manufacturer Continental, and Vale, the Brazilian iron ore company.
Among detractors from performance was Meituan, the Chinese food delivery company, where increased competition hurt results. Another detractor was KE Holdings, the leading real estate broker and online real estate presence in China, which was hampered by the slow recovery of the Chinese property market.
Regarding capital allocation decisions, we made several valuation trims where we felt the margin of safety had narrowed due to strong performance, although we continue to like the businesses themselves. In technology, we trimmed our positions in Samsung, Tokyo Electron, and Sea Limited (an e-commerce leader throughout Southeast Asia). We sold outright one technology holding based on valuation—Coupang, the South Korean e-commerce leader.
Financials also had a very strong 2025 and we made some trims there as well. We trimmed Danske Bank and sold out of DBS, the Singaporean bank, both on valuation. For example, when we first added to Danske Bank, it was trading at well below book value but today trades at about 1.4x book—still reasonable, but enough for us to do some trimming. Similarly, DBS is a high-growth company but trades at 2.3–2.4x book value, and we thought we had better opportunities in the portfolio.
An area where we have added is industrials and materials. We built a new position in Vale, the Brazilian iron ore producer, because on average their ore has a higher iron content with fewer impurities than rival companies, giving them a competitive advantage.
We added Aumovio, the German car parts manufacturer, because we think spinoffs are an attractive space to look at. Aumovio is not a very high-growth company, but the valuation was attractive at 8x book when we bought it. It also has a JV with Aurora, a U.S. self-driving trucking start-up technology which we believe will roll out in a couple of years. If it is successful, we will have purchased a free option on the JV by buying Aumovio.
In Asia, we added to Itochu, the Japanese sogo shohsa (trading company or industrial conglomerate) and to Full Truck Alliance, the Chinese trucking logistics company. Both companies were trading at very low valuations and seemed to offer a lot of upside.
We explained previously how different our portfolio is from the benchmark in terms of its selectivity, earnings growth profile and valuation. As a result of our active selection process, it also differs from the index in other key respects.
Country weightings are an example. We are extremely selective about the countries we invest in and have exposure to only a few countries relative to the index. We focus on countries with strong economic growth and innovation alongside established rule of law and stable governments. China is our largest single country weighting, and we are significantly overweight there compared to the benchmark. Stock valuations are much lower in China than elsewhere, and we are seeing some very good opportunities in selected Chinese companies.
Our sector weightings are also quite different from the index. We are overweight in consumer discretionary and financials and underweight in technology.
As a result, our individual holdings look very different than the index, and our active share—which measures the degree of difference between a portfolio’s holdings and those of its benchmark—is very high at 96%.
Investment Landscape:
Looking Beyond the Headlines
In today’s investment landscape, we are seeing selective opportunities across the major regions that we invest in.
As noted, we are significantly overweight China. Outside the U.S. it is the world’s most dynamic and innovative economy with many global leaders in high value-added industries. We are impressed by the major advancements that are coming out of China. For example, it produces 80% of the world’s solar panels and 70% of its wind turbines. It has the world’s largest electric vehicle market and is home to the world’s biggest EV manufacturer. AI is also a major growth focus in China.
We believe investors should be paying attention. Companies in China have the advantage of a huge domestic market and they are increasingly using that scale to go international. That was not necessarily the case a decade ago, but increasingly we are seeing them compete on a global basis. At the same time, there are risks in China, chief among them probably geopolitical risk and relationships with the rest of the world, and we are monitoring these closely.
Europe is another area of focus for us. It is home to many tremendous established multinational corporations with great brands. However, Europe also has structural headwinds, whether regulatory, demographic or cultural (for example, an aversion to risk-taking). In fact, the key risk when investing in Europe is the extent to which these trends will persist and continue to suppress growth and innovation.
We are invested in select European financials, including Danske Bank, the leading bank in Denmark, and Julius Baer, a major global wealth manager from Switzerland. Elsewhere we have found some attractive companies and invested opportunistically —for example, in Aumovio, the German car parts manufacturer.
We are also looking at emerging markets and recently added several names, including in Brazil, which we consider a very interesting market. Our research process is global, but we try to stay selective in terms of the countries that we invest in.
No discussion of opportunities would be complete without talking about AI. In this space, as in others, we are price-conscious and valuation-sensitive investors. As a result, we are focusing on the bottlenecks in AI and the companies solving them. One bottleneck is power. Natural gas is a solution to the massive power demands of data centers and many new natural gas power plants are being built. We own Tourmaline, a Canadian natural gas producer with very low-cost reserves which distributes gas in Canada but also exports to the U.S., especially to California where it is a very large provider. Data center power demand is a growth driver for this business.
Semiconductor manufacturing is another AI bottleneck and here we own Tokyo Electron, one of the world’s top semiconductor equipment companies. It is based in Japan but competes on a global basis. Demand is extremely strong, driven by companies in Taiwan and South Korea and the U.S. and elsewhere that are building fabs to manufacture semiconductors.
Memory chips are a core AI component where we are seeing supply squeezes, and we have added names in this space. One is Samsung, the leader in high bandwidth memory. There is a huge demand for memory and prices have nearly doubled in recent months. We think Samsung could be extremely profitable in this space.
In China, we have made several investments in consumer-facing technology companies, where China has some world leaders. Tencent, partially owned by Prosus and Naspers, two holding companies listed in Europe, is the number one video game company in China as well as a leading platform for messaging and social media. Tencent is ubiquitous on Chinese mobile phones. We also have positions in Meituan, the food delivery leader in China, and DiDi, the top Chinese ride-sharing company. These are very well-run firms with excellent long-term growth prospects.
Another space that we are looking at in China, admittedly somewhat under the radar, is life insurance. This is a long-term multi-decade secular growth story, in our view. Chinese households are pivoting away from channelling their savings into the property market and are looking for other investment vehicles. We expect life insurance and other insurance products to benefit from this shift. The percentage of Chinese household savings in life insurance is still small and we think it has a long growth path ahead of it.
We have a position in Ping An Insurance, a major Chinese life insurer, and recently met with its founder and chairman, Peter Ma. The company appears to be well-positioned. It has gone through a major restructuring to improve the training and quality of its sales force which should pay dividends going forward, yet Ping An is trading at only 6x or 7x earnings. AIA is the other major Chinese life insurer, based in Hong Kong, with roots going back over a century. It has Pan-Asian presence and a very well-established, strong brand name throughout the region.
Finally, in industrials and materials, we have built positions in Vale, the Brazilian iron ore producer and Aumovio, the German car parts manufacturer. We also hold Full Truck Alliance, a Chinese trucking logistics company that is bringing the business of connecting freight and truckers online. Historically this was done by phone or face-to-face in fields beside highways so Full Truck is creating new efficiencies in this marketplace. The company is gaining share and is likely to become even more streamlined as it rolls AI into its operations.
We continue to believe that there are tremendous investment opportunities around the world if you look beyond the biggest companies in any market and are ready to do intensive research. Our methodology produced strong performance in 2025, yet the portfolio’s valuation remains low, which is a foundation for strong results going forward.
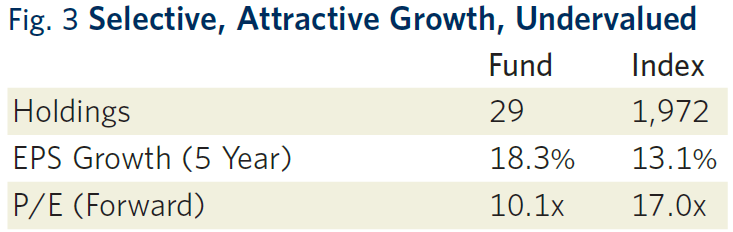
Putting it all together, we believe the fund’s structural characteristics are compelling—specifically, the selectivity of our investment process coupled with the fact that our portfolio companies have a materially higher earnings growth rate than the index average while trading at a meaningful discount to it (see Figure 3). This underpins why we are so optimistic about our prospects going forward.
Together on This Journey
For more than 50 years, Davis Advisors has navigated a constantly changing investment landscape guided by one North Star: to grow the value of the funds entrusted to us. We are pleased to have achieved strong results thus far and look forward to the decades ahead. With more than $2 billion of our own money invested in our portfolios, we stand shoulder to shoulder with our clients on this long journey.2 We are grateful for your trust and are well-positioned for the future.
Five-year EPS Growth Rate (5-year EPS) is the average annualized earnings per share growth for a company over the past 5 years. The values shown are the weighted average of the 5-year EPS of the stocks in the Fund or Index. Approximately 22.83% of the assets of the Fund are not accounted for in the calculation of 5-year EPS as relevant information on certain companies is not available to the Fund’s data provider. Forward Price/Earnings (Forward P/E) Ratio is a stock’s price at the date indicated divided by the company’s forecasted earnings for the following 12 months based on estimates provided by the Fund’s data provider. These values for both the Fund and the Index are the weighted average of the stocks in the portfolio or Index.
As of 12/31/25, Davis Advisors, the Davis family and Foundation, our employees, and Fund directors have more than $2 billion invested alongside clients in similarly managed accounts and strategies.
This material is authorized for use by existing shareholders. A current Davis International Fund prospectus must accompany or precede this material if it is distributed to prospective shareholders. You should carefully consider the Fund’s investment objective, risks, charges, and expenses before investing. Read the prospectus carefully before you invest or send money.
This material includes candid statements and observations regarding investment strategies, individual securities, and economic and market conditions; however, there is no guarantee that these statements, opinions or forecasts will prove to be correct. These comments may also include the expression of opinions that are speculative in nature and should not be relied on as statements of fact.
Davis Advisors is committed to communicating with our investment partners as candidly as possible because we believe our investors benefit from understanding our investment philosophy and approach. Our views and opinions include “forward-looking statements” which may or may not be accurate over the long term. Forward-looking statements can be identified by words like “believe,” “expect,” “anticipate,” or similar expressions. You should not place undue reliance on forward-looking statements, which are current as of the date of this report. We disclaim any obligation to update or alter any forward-looking statements, whether as a result of new information, future events, or otherwise. While we believe we have a reasonable basis for our appraisals and we have confidence in our opinions, actual results may differ materially from those we anticipate.
Objective and Risks. The investment objective of Davis International Fund is long-term growth of capital. There can be no assurance that the Fund will achieve its objective. Some important risks of an investment in the Fund are: stock market risk: stock markets have periods of rising prices and periods of falling prices, including sharp declines; common stock risk: an adverse event may have a negative impact on a company and could result in a decline in the price of its common stock; foreign country risk: foreign companies may be subject to greater risk as foreign economies may not be as strong or diversified; China risk – generally: investment in Chinese securities may subject the Fund to risks that are specific to China including, but not limited to, general development, level of government involvement, wealth distribution, and structure; headline risk: the Fund may invest in a company when the company becomes the center of controversy. The company’s stock may never recover or may become worthless; depositary receipts risk: depositary receipts involve higher expenses and may trade at a discount (or premium) to the underlying security; foreign currency risk: the change in value of a foreign currency against the U.S. dollar will result in a change in the U.S. dollar value of securities denominated in that foreign currency; exposure to industry or sector risk: significant exposure to a particular industry or sector may cause the Fund to be more impacted by risks relating to and developments affecting the industry or sector; emerging market risk: securities of issuers in emerging and developing markets may present risks not found in more mature markets. As of 12/31/22, the Fund had approximately 48.2% of net assets invested in securities from emerging markets; large-capitalization companies risk: companies with $10 billion or more in market capitalization generally experience slower rates of growth in earnings per share than do mid- and small-capitalization companies; manager risk: poor security selection may cause the Fund to underperform relevant benchmarks; fees and expenses risk: the Fund may not earn enough through income and capital appreciation to offset the operating expenses of the Fund; and mid- and small-capitalization companies risk: companies with less than $10 billion in market capitalization typically have more limited product lines, markets and financial resources than larger companies, and may trade less frequently and in more limited volume. See the prospectus for a complete description of the principal risks.
The information provided in this material should not be considered a recommendation to buy, sell or hold any particular security. As of 12/31/25, the top ten holdings of Davis International Fund were: Ping An Insurance Group, 7.13%; Prosus, 6.37%; Samsung Electronics, 5.98%; Danske Bank, 5.49%; Julius Baer Group, 5.35%; AIA Group, 5.07%; Trip.com Group, 4.78%; Full Truck Alliance, 4.42%; DiDi Global, 4.33%; and Tokyo Electron, 4.21%.
Davis Funds has adopted a Portfolio Holdings Disclosure policy that governs the release of non-public portfolio holding information. This policy is described in the Statement of Additional Information. Holding percentages are subject to change. Visit davisfunds.com or call 800-279-0279 for the most current public portfolio holdings information.
The Global Industry Classification Standard (GICS®) is the exclusive intellectual property of MSCI Inc. (MSCI) and S&P Global (“S&P”). Neither MSCI, S&P, their affiliates, nor any of their third party providers (“GICS Parties”) makes any representations or warranties, express or implied, with respect to GICS or the results to be obtained by the use thereof, and expressly disclaim all warranties, including warranties of accuracy, completeness, merchantability and fitness for a particular purpose. The GICS Parties shall not have any liability for any direct, indirect, special, punitive, consequential or any other damages (including lost profits) even if notified of such damages.
The “Magnificent 7” is a group of seven dominant, high-performing U.S. technology companies that have a significant influence on the stock market. The companies that make up the Magnificent 7 are: Alphabet, Amazon, Apple, Meta Platforms, Microsoft, Nvidia, and Tesla.
We gather our index data from a combination of reputable sources, including, but not limited to, Lipper, Clearwater Wilshire Atlas, and index websites.
We gather our index data from a combination of reputable sources, including, but not limited to, Lipper, Wilshire, and index websites.
The MSCI ACWI (All Country World Index) ex U.S. is a free float-adjusted market capitalization weighted index that is designed to measure the equity market performance of developed and emerging markets, excluding the United States. The index includes reinvestment of dividends, net of foreign withholding taxes. Investments cannot be made directly in an index.
After 4/30/26, this material must be accompanied by a supplement containing performance data for the most recent quarter end.
Item #4760 12/25 Davis Distributors, LLC, 2949 East Elvira Road, Suite 101, Tucson, AZ 85756, 800-279-0279, davisfunds.com
International Fund
Annual Review 2026
Managers